Climate change represents a critical environmental challenge that continues to shape our global and local landscapes. As the planet warms, we are witnessing substantial changes: rising temperatures, shifting precipitation patterns, and increased frequency of extreme weather events. Locally, in the Kawartha region, these changes are not just theoretical forecasts but evolving realities impacting our ecosystems, water resources, and community livelihoods.
The shift in climate has led to milder winters, more intense summer heatwaves, and altered hydrological cycles, affecting both natural habitats and the services they provide. Amid these challenges, there also lie opportunities for innovation and resilience.
Kawartha Conservation is dedicated to understanding these impacts and taking strategic actions to mitigate risks and enhance the adaptability of our community and environment. Our initiatives and strategies are designed to tackle these pressing issues, ensuring a sustainable future for the Kawartha watershed.
Local changes
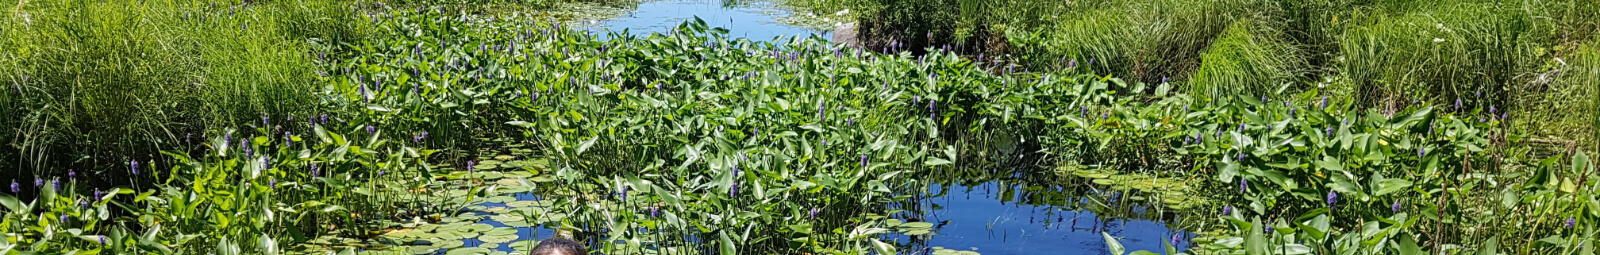
Climate change is a global phenomenon, and its effects are clearly felt within our local watershed, which is witnessing a gradual increase in temperatures. The once bitter winters are becoming milder, with less frequent snowfalls and more rainfall during these colder months.
During the summer, we are experiencing hotter days that extend into prolonged heatwaves. With warmer air capable of holding more moisture, rainfall events are becoming less frequent yet more intense when they do occur.
These climatic shifts are already affecting our water resources—rivers and creeks in the area frequently reach and exceed historical high water levels. The spring freshet arrives earlier, while the low water levels of summer and fall are becoming more pronounced and enduring. As these trends continue, the impacts on our environment and communities are expected to intensify.
In recognition of these challenges, Kawartha Conservation has crafted the 10-Year Climate Change Strategy. This pivotal document replaces our previous strategy and background paper, reflecting our ongoing commitment to addressing climate change with a forward-looking and strategic approach. Drawing upon the latest local data and research, this strategy outlines proactive measures and innovative actions aimed at bolstering our watershed’s resilience against the evolving climate landscape.
The 10-Year Climate Change Strategy is a testament to our dedication to safeguarding our natural resources, enhancing ecosystem resilience, and supporting our communities in adapting to these unavoidable climate realities.
Snow Data: 1987 - 2021
To visualize snow depth by area and year across the Kawartha watershed, staff have developed an interactive Snow Data site to view the following information:
- Snow Depth by Date
- Snow Depth - All Available Data
- Average Snow Depth by Year
- Maximum Snow Depth by Year, and
- Monitoring Locations
Visitors can view trends over time for each monitored location including:
- Indian Point Provincial Park
- Ken Reid Conservation Area
- Pigeon River Conservation Area
- Woodville
View Snow Data from across our watershed here: https://www.kawarthaconservation.com/SnowData/
2021 Precipitation Data
To visualize 2021 monthly precipitation data across the Kawartha watershed, staff have developed an interactive precipitation site to view information from three locations:
- Indian Point Weather Station
- Ken Reid Weather Station
- Port Perry Weather Station
2021 Precipitation Data Summary
-
Precipitation varied significantly in 2021. On the one hand, we experienced "wet" months that were close or above the historically highest monthly amounts. On the other, very "dry" months with low precipitation were observed. However, the total precipitation recorded over the course of the year in 2021 was about the average for long-term amounts across all monitoring gauges.
-
July and September were the wettest months of the year for the Kawartha Conservation watershed. Amount of rain observed in the central and northern portions of the watershed (areas north of Little Britain) in September was two times more of the long-term average for that month, while the southern part of the watershed received at least 130% of the long-term monthly normal amount of rain.
-
The wettest day of the year was September 23rd, with precipitation gauges across the watershed registering 44-84 mm of rain. Those daily amounts are at least 50% more than the long-term average for the whole month of September at the respective monitoring locations.
-
On the contrary, January, May, and August demonstrated a significant deficit of precipitation. During those months, average precipitation amounts recorded by the monitoring stations across the watershed were 47%, 26%, and 55% of the long-term average values, respectively. In fact, only 10.6 mm of rain fell in Emily Provincial Park during the entire month of May.
View 2021 Monthly Precipitation Data
View 2020 Monthly Precipitation Data
Climate change documents and resources
Government resources |
|
Information on actions by the federal, provincial and local governments is available from these websites: |
Research |
|
Important and interesting reports on climate change research can be found at the following websites: |
Actions |
|
What action can we all take? |