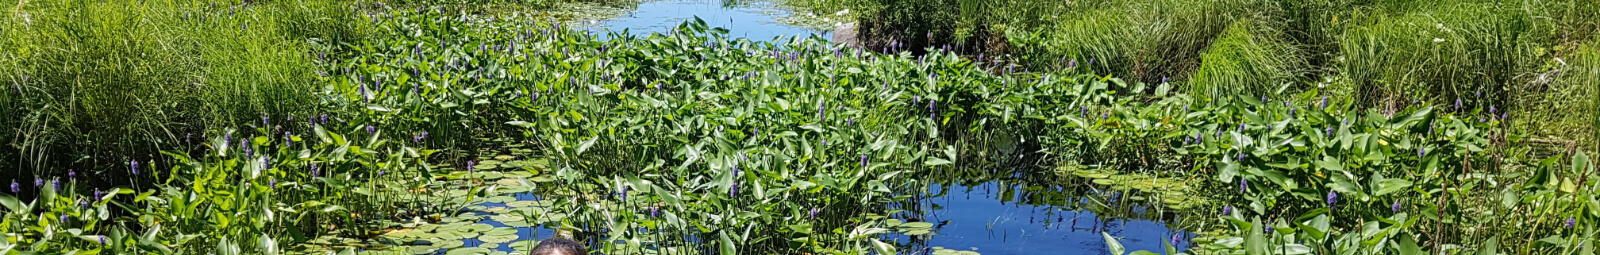
 The Nonquon River is situated to the southwest of Lake Scugog. Water flows northward off of the Oak Ridges Moraine, and into the western basin of Lake Scugog east of the town of Seagrave.
View a map of the Nonquon River Watershed
Watershed characteristics
Learn about the characteristics of the Nonquon River watershed.
Watershed size |
|
The total watershed area is 145 km² or 14,465 ha and the total watercourse length is 169 km. |
Natural vegetation cover |
|
The dominant forest type is coniferous forest including:
|
Significant natural sites |
|
Provincially Significant Wetlands
Area of Natural and Scientific Interest (ANSI) - Life Science
ANSI - Earth Science: Uxbridge-Lobe Glacial River Deposits: 125 ha |
Environmental conditions
The following grades show the environmental conditions for the Nonquon River watershed.
| Indicator | Result | Grade | Status |
|---|---|---|---|
|
Total phosphorus |
0.051 mg/L |
C |
Fair |
|
Benthic macroinvertebrates |
4.73 (FBI) |
B |
Good |
The surface water quality grade was based on total phosphorous (TP) and/or benthic macroinvertebrates (aquatic insects) family biotic index (FBI). The provincial water quality objective for TP in rivers and streams is 0.03 mg/L and 0.02 mg/L in lakes. These guidelines were set because levels highter than these guildelines provide conditions for nuisance algae and aquatic plant growth. A TP value below 0.03 mg/L (rivers) or 0.02 (lakes) meets the provincial guidelines and is in the B (good) or A (excellent) grade range, while the result for benthic macroinvertebrates must be 5.00 or lower to receive a B (good) or A (very good to excellent) grade.
| Indicator | Result | Indicator grade | Combined grade |
|---|---|---|---|
|
Nitrate + nitrite |
0.090 mg/L |
A |
A |
|
Chloride |
20.00 mg/L |
A |
N/A |
Nitrogen levels in this well are excellent, falling below the Provincial Maximum Acceptable Concentration of 10 mg/L for drinking water. Chloride levels also receive an excellent grade, as they fall well below the Provincial Aesthetic Objective of 250 mg/L for drinking water. Groundwater quality results from the wells do not represent groundwater quality across the subwatershed, but rather, the water quality within the aquifer in which the well is located.
| Indicator | Area cover | Percent cover | Grade | Status |
|---|---|---|---|---|
|
Forest cover |
41.8 km² |
28.9% |
B |
Good |
|
Forest interior |
10.6 km² |
7.4% |
C |
Fair |
|
Forested riparian cover |
3.6 km² |
36.2% |
C |
Fair |
The combined forest conditions grade for Nonquon River is ranked as fair.
| Indicator | Area cover | Percent cover | Grade | Status |
|---|---|---|---|---|
|
Wetland cover |
25.8 km² |
17.8% |
A |
Excellent |